#339 - Five Years Tracked
Motto: Gentleman on the Streets, Freak in the Spreadsheets
The Life Tracker.
It was never given a better name - but it started with a worse name. If you don't believe me you can read what I wrote about my new "Life Tracking System (LTS)" in Column #83. That was five years ago - meaning I've been doing this thing for five years now.
If you don't choose to read Column #83 (I don't blame you) - you should know that reading it now made me proud of what I've accomplished here. I set out to track my life, I defined what that meant to me - and really I did a damn good job of it. My original goals have only shifted slightly in the past 1827 days.
Originally, I intended to track:
Originally, I intended to track:
1. Diet
2. Exercise
3. Money
4. Daily Goals (which I stole from Demetri Martin)
5. What I did each day (high level list of events)
Looking at that list now, it's a pretty good cross-section of the things that are important in life. Especially when you consider I haven't had to change 24 of the 25 Daily Goals I set up when I was fresh out of college - they're still relevant now that I'm five+ years into my career.
Looking at that list now, it's a pretty good cross-section of the things that are important in life. Especially when you consider I haven't had to change 24 of the 25 Daily Goals I set up when I was fresh out of college - they're still relevant now that I'm five+ years into my career.
That's what I set out to do... and that's what I achieved. I failed on exactly zero of those ambitions. In addition - I found a way to include my weight, sleep, health, happiness, location, steps taken, calories burned, some specific tags for any given day, and finally the weather (cause why not) all while requiring less daily maintenance than it did when I started. Nearly half the data today just come in automatically. The spreadsheet has 105 columns, 92,665 individual data points. Here come a ton of graphics.
Below - basic averages, data by day-of-week, data over time by month, data over time by year, then the pinnacle findings.
To make the simple data more interesting I'm going to use cutesy data visualizations:
Below - basic averages, data by day-of-week, data over time by month, data over time by year, then the pinnacle findings.
To make the simple data more interesting I'm going to use cutesy data visualizations:
 |
| Average Goals Completed Per Day Per Category |
 |
| Average Macro Breakdown |
 |
| Average Daily Calorie Intake (2807) made out of Clipart Hamburgers |
 |
| Average Sleep: 7 hours 21 minutes from 11:27 PM to 6:38 AM |


Alright I'm better at making graphs. Here's the more interesting results using regular data visualizations...
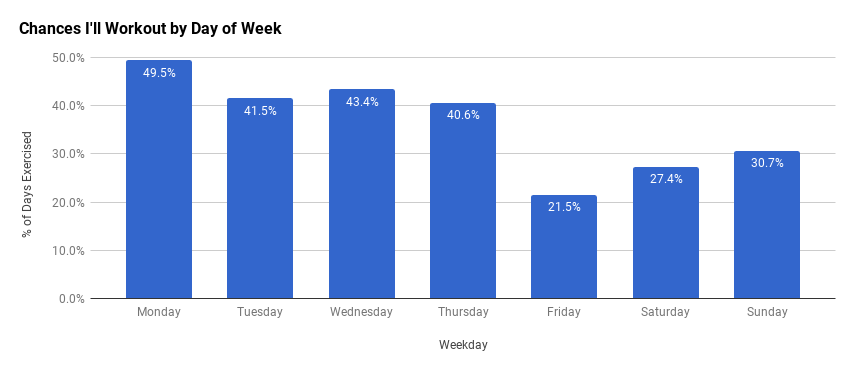
"By day of week" charts:


"Over time" charts, by month:
 |
| Calories and weight sort of follow one-another |
 |
| My one Paleo month is easy to spot and I'm slowly eating more fats |
 |
| This doesn't tell me a whole lot, but it's purdy |
 |
| Mostly noise - if anything there's a sinusoidal pattern happening |
 |
| I'm going to bed earlier as time goes |
Over time, by year:
 |
| 2016 is the year I stopped really trying to get huge |
 |
| I was on a good trend, then when I stopped trying to get huge I started trading protein for fats |
 |
| Work up, social down, body down - makes sense & kid of sucks |
 |
| Speaking of sucking (I didn't start tracking some things until 2014) |
 |
| SPEAKING OF SUCKING |
Pinnacle Findings:
 |
| I weigh more over the summer than the winter |
 |
| The earlier I wake up, the more I get done (duh) |
 |
| I eat more if I wokr out in the morning, and less if I nap, weirdly being sick doesn't affect my calorie intake as much as just "not going to work" does |
I had a brainstorm during the writing of this Column. This whole thing was an exercise in correlations... but rather than guessing at which correlations would be meaningful, why not just check ALL of them?

For a better view of these correlations, this whole sentence is a link to a copy of that sheet.
Alright - that's all I'm going to write for now. It's time to move on.
So - I've been saying for years that my plan was to roll the Life Tracker up into some sort of distributable Android Application - and truthfully I still might - but I've realized over the past half year that a spreadsheet really is the best way to house this data. Writing an app has proven tedious and annoying and most of the effort I've put into it is just towards recreating what's native to spreadsheet applications. The ultimate product I'd make wouldn't be more capable than the thing I've already made unless I quit my job and dedicated a year of my life to make it so... and that's just not worth it. Not right now.
So then - do I stop? Do I say "good job, me!" and pack it in? Or do I keep going as is?
I'm not stopping - but I'm also not going to keep going this hard. I'll figure it out.
So then - do I stop? Do I say "good job, me!" and pack it in? Or do I keep going as is?
I'm not stopping - but I'm also not going to keep going this hard. I'll figure it out.
Top 5: Unplanned Benefits of The Life Tracker
5. Synergy with my 30 Day Challenge project (which I stole from Matt Cutts).
4. Synergy with my Second-A-Day Video project (which I stole from an artist named Madeline).
3. Helped with doctor's appointments, taxes, and dozens of "when was it that I did ____" situations. I hadn't really thought about how it would help with that stuff.
2. It's kept me honest with myself about things its not fun to be honest with yourself about. This probably wasn't "unplanned", but whatever.
1. The tools and techniques I forced myself to learn to build it have become invaluable in my career. The work I put into this project gave me the confidence and capability to make real impacts to the business.
Actual Quote:
"It's a good reminder though, especially now when it feels like the world is crumbling and life is just happening at us. We forget that we all have the capability and the possibility and the skillset and the tools to create the future we want. The future doesn't just show up fully formed, you know, we are creating it in the present, but we have to be willing to make some short-term sacrifices for long-term gain - and that's the challenge. The challenge is that we tend to think in the now, in the United States and we think in the now and short-shift ourselves in the future. So I think it's a great idea for us all to be optimistic about the world that we're creating but we have to put the wheels in motion to make that optimistic future happen."- Lindsey Turrentine from TWIT on 4/15/2018" -


Comments